Supervised Learning
scribble
- supervised learning
- regression
- classification
- support vector machine.
- infinite number of attributes.
slides
transcript
In this video I am going to define what is probably the most common type of machine learning problem, which is supervised learning. I’ll define supervised learning more formally later, but it’s probably best to explain or start with an example of what it is and we’ll do the formal definition later.
Let’s say you want to predict housing prices. A while back, a student collected data sets from the Institute of Portland Oregon. And let’s say you plot a data set and it looks like this. Here on the horizontal axis, the size of different houses in square feet, and on the vertical axis, the price of different houses in thousands of dollars. So. Given this data, let’s say you have a friend who owns a house that is, say 750 square feet and hoping to sell the house and they want to know how much they can get for the house. So how can the learning algorithm help you? One thing a learning algorithm might be able to do is put a straight line through the data or to fit a straight line to the data and, based on that, it looks like maybe the house can be sold for maybe about $150,000. But maybe this isn’t the only learning algorithm you can use. There might be a better one. For example, instead of sending a straight line to the data, we might decide that it’s better to fit a quadratic function or a second-order polynomial to this data. And if you do that, and make a prediction here, then it looks like, well, maybe we can sell the house for closer to $200,000.
One of the things we’ll talk about later is how to choose and how to decide do you want to fit a straight line to the data or do you want to fit the quadratic function to the data and there’s no fair picking whichever one gives your friend the better house to sell. But each of these would be a fine example of a learning algorithm. So this is an example of a supervised learning algorithm. And the term supervised learning refers to the fact that we gave the algorithm a data set in which the “right answers” were given. That is, we gave it a data set of houses in which for every example in this data set, we told it what is the right price so what is the actual price that, that house sold for and the job of the algorithm was to just produce more of these right answers such as for this new house, you know, that your friend may be trying to sell.
To define with a bit more terminology this is also called a regression problem and by regression problem I mean we’re trying to predict a continuous value output. Namely the price. So technically I guess prices can be rounded off to the nearest cent. So maybe prices are actually discrete values, but usually we think of the price of a house as a real number, as a scalar value, as a continuous value number and the term regression refers to the fact that we’re trying to predict the sort of continuous values attribute.
Here’s another supervised learning example, some friends and I were actually working on this earlier. Let’s see you want to look at medical records and try to predict of a breast cancer as malignant or benign. If someone discovers a breast tumor, a lump in their breast, a malignant tumor is a tumor that is harmful and dangerous and a benign tumor is a tumor that is harmless. So obviously people care a lot about this.
Let’s see a collected data set and suppose in your data set you have on your horizontal axis the size of the tumor and on the vertical axis I’m going to plot one or zero, yes or no, whether or not these are examples of tumors we’ve seen before are malignant which is one or zero if not malignant or benign. So let’s say our data set looks like this where we saw a tumor of this size that turned out to be benign. One of this size, one of this size. And so on. And sadly we also saw a few malignant tumors, one of that size, one of that size, one of that size… So on. So this example… I have five examples of benign tumors shown down here, and five examples of malignant tumors shown with a vertical axis value of one. And let’s say we have a friend who tragically has a breast tumor, and let’s say her breast tumor size is maybe somewhere around this value. The machine learning question is, can you estimate what is the probability, what is the chance that a tumor is malignant versus benign?
To introduce a bit more terminology this is an example of a classification problem. The term classification refers to the fact that here we’re trying to predict a discrete value output: zero or one, malignant or benign. And it turns out that in classification problems sometimes you can have more than two values for the two possible values for the output. As a concrete example maybe there are three types of breast cancers and so you may try to predict the discrete value of zero, one, two, or three with zero being benign. Benign tumor, so no cancer. And one may mean, type one cancer, like, you have three types of cancer, whatever type one means. And two may mean a second type of cancer, a three may mean a third type of cancer. But this would also be a classification problem, because this other discrete value set of output corresponding to, you know, no cancer, or cancer type one, or cancer type two, or cancer type three.
In classification problems there is another way to plot this data. Let me show you what I mean. Let me use a slightly different set of symbols to plot this data. So if tumor size is going to be the attribute that I’m going to use to predict malignancy or benignness, I can also draw my data like this. I’m going to use different symbols to denote my benign and malignant, or my negative and positive examples. So instead of drawing crosses, I’m now going to draw O’s for the benign tumors. Like so. And I’m going to keep using X’s to denote my malignant tumors. Okay? I hope this is beginning to make sense. All I did was I took, you know, these, my data set on top and I just mapped it down. To this real line like so. And started to use different symbols, circles and crosses, to denote malignant versus benign examples. Now, in this example we use only one feature or one attribute, mainly, the tumor size in order to predict whether the tumor is malignant or benign.
In other machine learning problems when we have more than one feature, more than one attribute. Here’s an example. Let’s say that instead of just knowing the tumor size, we know both the age of the patients and the tumor size. In that case maybe your data set will look like this where I may have a set of patients with those ages and that tumor size and they look like this. And a different set of patients, they look a little different, whose tumors turn out to be malignant, as denoted by the crosses. So, let’s say you have a friend who tragically has a tumor. And maybe, their tumor size and age falls around there. So given a data set like this, what the learning algorithm might do is throw the straight line through the data to try to separate out the malignant tumors from the benign ones and, so the learning algorithm may decide to throw the straight line like that to separate out the two classes of tumors. And. You know, with this, hopefully you can decide that your friend’s tumor is more likely to if it’s over there, that hopefully your learning algorithm will say that your friend’s tumor falls on this benign side and is therefore more likely to be benign than malignant.
In this example we had two features, namely, the age of the patient and the size of the tumor. In other machine learning problems we will often have more features, and my friends that work on this problem, they actually use other features like these, which is clump thickness, the clump thickness of the breast tumor. Uniformity of cell size of the tumor. Uniformity of cell shape of the tumor, and so on, and other features as well. And it turns out one of the interes-, most interesting learning algorithms that we’ll see in this class is a learning algorithm that can deal with, not just two or three or five features, but an infinite number of features.
On this slide, I’ve listed a total of five different features. Right, two on the axes and three more up here. But it turns out that for some learning problems, what you really want is not to use, like, three or five features. But instead, you want to use an infinite number of features, an infinite number of attributes, so that your learning algorithm has lots of attributes or features or cues with which to make those predictions. So how do you deal with an infinite number of features. How do you even store an infinite number of things on the computer when your computer is gonna run out of memory. It turns out that when we talk about an algorithm called the Support Vector Machine, there will be a neat mathematical trick that will allow a computer to deal with an infinite number of features.
Imagine that I didn’t just write down two features here and three features on the right. But, imagine that I wrote down an infinitely long list, I just kept writing more and more and more features. Like an infinitely long list of features. Turns out, we’ll be able to come up with an algorithm that can deal with that.
So, just to recap. In this class we’ll talk about supervised learning. And the idea is that, in supervised learning, in every example in our data set, we are told what is the “correct answer” that we would have quite liked the algorithms have predicted on that example. Such as the price of the house, or whether a tumor is malignant or benign. We also talked about the regression problem. And by regression, that means that our goal is to predict a continuous valued output. And we talked about the classification problem, where the goal is to predict a discrete value output.
Just a quick wrap up question: Suppose you’re running a company and you want to develop learning algorithms to address each of two problems. In the first problem, you have a large inventory of identical items. So imagine that you have thousands of copies of some identical items to sell and you want to predict how many of these items you sell within the next three months. In the second problem, problem two, you’d like– you have lots of users and you want to write software to examine each individual of your customer’s accounts, so each one of your customer’s accounts; and for each account, decide whether or not the account has been hacked or compromised. So, for each of these problems, should they be treated as a classification problem, or as a regression problem? When the video pauses, please use your mouse to select whichever of these four options on the left you think is the correct answer. So hopefully, you got that this is the answer. For problem one, I would treat this as a regression problem, because if I have, you know, thousands of items, well, I would probably just treat this as a real value, as a continuous value. And treat, therefore, the number of items I sell, as a continuous value. And for the second problem, I would treat that as a classification problem, because I might say, set the value I want to predict with zero, to denote the account has not been hacked. And set the value one to denote an account that has been hacked into. So just like, you know, breast cancer, is, zero is benign, one is malignant. So I might set this be zero or one depending on whether it’s been hacked, and have an algorithm try to predict each one of these two discrete values. And because there’s a small number of discrete values, I would therefore treat it as a classification problem. So, that’s it for supervised learning and in the next video I’ll talk about unsupervised learning, which is the other major category of learning algorithms.
unsupervised learning
- clustering is one type of unsupervised learning.
- Pitch about octave. Andrew Ng is highly insistent that I learn octave.
scribble

transcripts
In this video, we’ll talk about the second major type of machine learning problem, called Unsupervised Learning. In the last video, we talked about Supervised Learning. Back then, recall data sets that look like this, where each example was labeled either as a positive or negative example, whether it was a benign or a malignant tumor. So for each example in Supervised Learning, we were told explicitly what is the so-called right answer, whether it’s benign or malignant. In Unsupervised Learning, we’re given data that looks different than data that looks like this that doesn’t have any labels or that all has the same label or really no labels. So we’re given the data set and we’re not told what to do with it and we’re not told what each data point is. Instead we’re just told, here is a data set. Can you find some structure in the data? Given this data set, an Unsupervised Learning algorithm might decide that the data lives in two different clusters. And so there’s one cluster and there’s a different cluster. And yes, Supervised Learning algorithm may break these data into these two separate clusters. So this is called a clustering algorithm. And this turns out to be used in many places. One example where clustering is used is in Google News and if you have not seen this before, you can actually go to this URL news.google.com to take a look. What Google News does is everyday it goes and looks at tens of thousands or hundreds of thousands of new stories on the web and it groups them into cohesive news stories. For example, let’s look here. The URLs here link to different news stories about the BP Oil Well story. So, let’s click on one of these URL’s and we’ll click on one of these URL’s. What I’ll get to is a web page like this. Here’s a Wall Street Journal article about, you know, the BP Oil Well Spill stories of “BP Kills Macondo”, which is a name of the spill and if you click on a different URL from that group then you might get the different story. Here’s the CNN story about a game, the BP Oil Spill, and if you click on yet a third link, then you might get a different story. Here’s the UK Guardian story about the BP Oil Spill. So what Google News has done is look for tens of thousands of news stories and automatically cluster them together. So, the news stories that are all about the same topic get displayed together. It turns out that clustering algorithms and Unsupervised Learning algorithms are used in many other problems as well. Here’s one on understanding genomics. Here’s an example of DNA microarray data. The idea is put a group of different individuals and for each of them, you measure how much they do or do not have a certain gene. Technically you measure how much certain genes are expressed. So these colors, red, green, gray and so on, they show the degree to which different individuals do or do not have a specific gene. And what you can do is then run a clustering algorithm to group individuals into different categories or into different types of people. So this is Unsupervised Learning because we’re not telling the algorithm in advance that these are type 1 people, those are type 2 persons, those are type 3 persons and so on and instead what were saying is yeah here’s a bunch of data. I don’t know what’s in this data. I don’t know who’s and what type. I don’t even know what the different types of people are, but can you automatically find structure in the data from the you automatically cluster the individuals into these types that I don’t know in advance? Because we’re not giving the algorithm the right answer for the examples in my data set, this is Unsupervised Learning. Unsupervised Learning or clustering is used for a bunch of other applications. It’s used to organize large computer clusters. I had some friends looking at large data centers, that is large computer clusters and trying to figure out which machines tend to work together and if you can put those machines together, you can make your data center work more efficiently. This second application is on social network analysis. So given knowledge about which friends you email the most or given your Facebook friends or your Google+ circles, can we automatically identify which are cohesive groups of friends, also which are groups of people that all know each other?
Market segmentation. Many companies have huge databases of customer information. So, can you look at this customer data set and automatically discover market segments and automatically group your customers into different market segments so that you can automatically and more efficiently sell or market your different market segments together? Again, this is Unsupervised Learning because we have all this customer data, but we don’t know in advance what are the market segments and for the customers in our data set, you know, we don’t know in advance who is in market segment one, who is in market segment two, and so on. But we have to let the algorithm discover all this just from the data. Finally, it turns out that Unsupervised Learning is also used for surprisingly astronomical data analysis and these clustering algorithms gives surprisingly interesting useful theories of how galaxies are born. All of these are examples of clustering, which is just one type of Unsupervised Learning. Let me tell you about another one.
I’m gonna tell you about the cocktail party problem. So, you’ve been to cocktail parties before, right? Well, you can imagine there’s a party, room full of people, all sitting around, all talking at the same time and there are all these overlapping voices because everyone is talking at the same time, and it is almost hard to hear the person in front of you. So maybe at a cocktail party with two people, two people talking at the same time, and it’s a somewhat small cocktail party. And we’re going to put two microphones in the room so there are microphones, and because these microphones are at two different distances from the speakers, each microphone records a different combination of these two speaker voices. Maybe speaker one is a little louder in microphone one and maybe speaker two is a little bit louder on microphone 2 because the 2 microphones are at different positions relative to the 2 speakers, but each microphone would cause an overlapping combination of both speakers’ voices. So here’s an actual recording of two speakers recorded by a researcher. Let me play for you the first, what the first microphone sounds like. One (uno), two (dos), three (tres), four (cuatro), five (cinco), six (seis), seven (siete), eight (ocho), nine (nueve), ten (y diez). All right, maybe not the most interesting cocktail party, there’s two people counting from one to ten in two languages but you know. What you just heard was the first microphone recording, here’s the second recording. Uno (one), dos (two), tres (three), cuatro (four), cinco (five), seis (six), siete (seven), ocho (eight), nueve (nine) y diez (ten). So we can do, is take these two microphone recorders and give them to an Unsupervised Learning algorithm called the cocktail party algorithm, and tell the algorithm - find structure in this data for you. And what the algorithm will do is listen to these audio recordings and say, you know it sounds like the two audio recordings are being added together or that have being summed together to produce these recordings that we had. Moreover, what the cocktail party algorithm will do is separate out these two audio sources that were being added or being summed together to form other recordings and, in fact, here’s the first output of the cocktail party algorithm. One, two, three, four, five, six, seven, eight, nine, ten. So, I separated out the English voice in one of the recordings. And here’s the second of it. Uno, dos, tres, quatro, cinco, seis, siete, ocho, nueve y diez. Not too bad, to give you one more example, here’s another recording of another similar situation, here’s the first microphone : One, two, three, four, five, six, seven, eight, nine, ten. OK so the poor guy’s gone home from the cocktail party and he ‘s now sitting in a room by himself talking to his radio. Here’s the second microphone recording. One, two, three, four, five, six, seven, eight, nine, ten. When you give these two microphone recordings to the same algorithm, what it does, is again say, you know, it sounds like there are two audio sources, and moreover, the album says, here is the first of the audio sources I found. One, two, three, four, five, six, seven, eight, nine, ten. So that wasn’t perfect, it got the voice, but it also got a little bit of the music in there. Then here’s the second output to the algorithm. Not too bad, in that second output it managed to get rid of the voice entirely. And just, you know, cleaned up the music, got rid of the counting from one to ten. So you might look at an Unsupervised Learning algorithm like this and ask how complicated this is to implement this, right? It seems like in order to, you know, build this application, it seems like to do this audio processing you need to write a ton of code or maybe link into like a bunch of synthesizer Java libraries that process audio, seems like a really complicated program, to do this audio, separating out audio and so on.
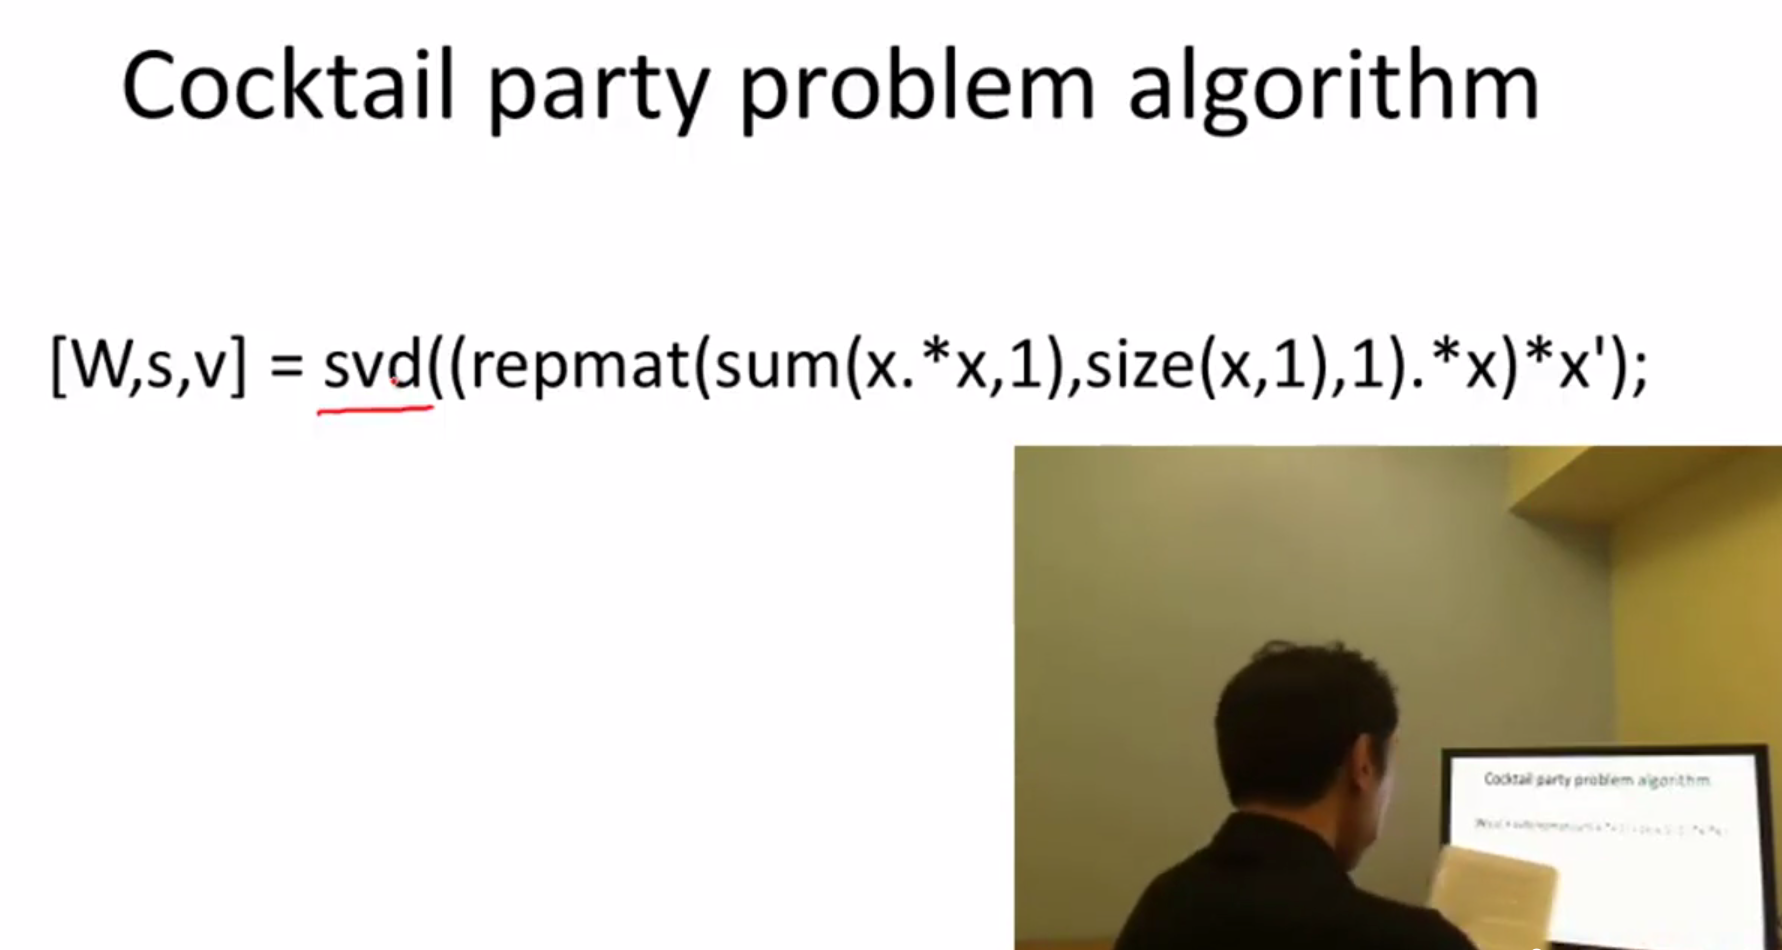
It turns out the algorithm, to do what you just heard, that can be done with one line of code - shown right here. It take researchers a long time to come up with this line of code. I’m not saying this is an easy problem, But it turns out that when you use the right programming environment, many learning algorithms can be really short programs. So this is also why in this class we’re going to use the Octave programming environment. Octave, is free open source software, and using a tool like Octave or Matlab, many learning algorithms become just a few lines of code to implement. Later in this class, I’ll just teach you a little bit about how to use Octave and you’ll be implementing some of these algorithms in Octave. Or if you have Matlab you can use that too.
It turns out the Silicon Valley, for a lot of machine learning algorithms, what we do is first prototype our software in Octave because software in Octave makes it incredibly fast to implement these learning algorithms. Here each of these functions like for example the SVD function that stands for singular value decomposition; but that turns out to be a linear algebra routine, that is just built into Octave. If you were trying to do this in C++ or Java, this would be many many lines of code linking complex C++ or Java libraries. So, you can implement this stuff as C++ or Java or Python, it’s just much more complicated to do so in those languages. What I’ve seen after having taught machine learning for almost a decade now, is that, you learn much faster if you use Octave as your programming environment, and if you use Octave as your learning tool and as your prototyping tool, it’ll let you learn and prototype learning algorithms much more quickly. And in fact what many people will do to in the large Silicon Valley companies is in fact, use an algorithm like Octave to first prototype the learning algorithm, and only after you’ve gotten it to work, then you migrate it to C++ or Java or whatever.
It turns out that by doing things this way, you can often get your algorithm to work much faster than if you were starting out in C++. So, I know that as an instructor, I get to say “trust me on this one” only a finite number of times, but for those of you who’ve never used these Octave type programming environments before, I am going to ask you to trust me on this one, and say that you, you will, I think your time, your development time is one of the most valuable resources. And having seen lots of people do this, I think you as a machine learning researcher, or machine learning developer will be much more productive if you learn to start in prototype, to start in Octave, in some other language. Finally, to wrap up this video, I have one quick review question for you. We talked about Unsupervised Learning, which is a learning setting where you give the algorithm a ton of data and just ask it to find structure in the data for us. Of the following four examples, which ones, which of these four do you think would will be an Unsupervised Learning algorithm as opposed to Supervised Learning problem. For each of the four check boxes on the left, check the ones for which you think Unsupervised Learning algorithm would be appropriate and then click the button on the lower right to check your answer. So when the video pauses, please answer the question on the slide. So, hopefully, you’ve remembered the spam folder problem. If you have labeled data, you know, with spam and non-spam e-mail, we’d treat this as a Supervised Learning problem. The news story example, that’s exactly the Google News example that we saw in this video, we saw how you can use a clustering algorithm to cluster these articles together so that’s Unsupervised Learning. The market segmentation example I talked a little bit earlier, you can do that as an Unsupervised Learning problem because I am just gonna get my algorithm data and ask it to discover market segments automatically. And the final example, diabetes, well, that’s actually just like our breast cancer example from the last video. Only instead of, you know, good and bad cancer tumors or benign or malignant tumors we instead have diabetes or not and so we will use that as a supervised, we will solve that as a Supervised Learning problem just like we did for the breast tumor data. So, that’s it for Unsupervised Learning and in the next video, we’ll delve more into specific learning algorithms and start to talk about just how these algorithms work and how we can, how you can go about implementing them.